Markets
Charted: Tesla’s Unrivaled Profit Margins
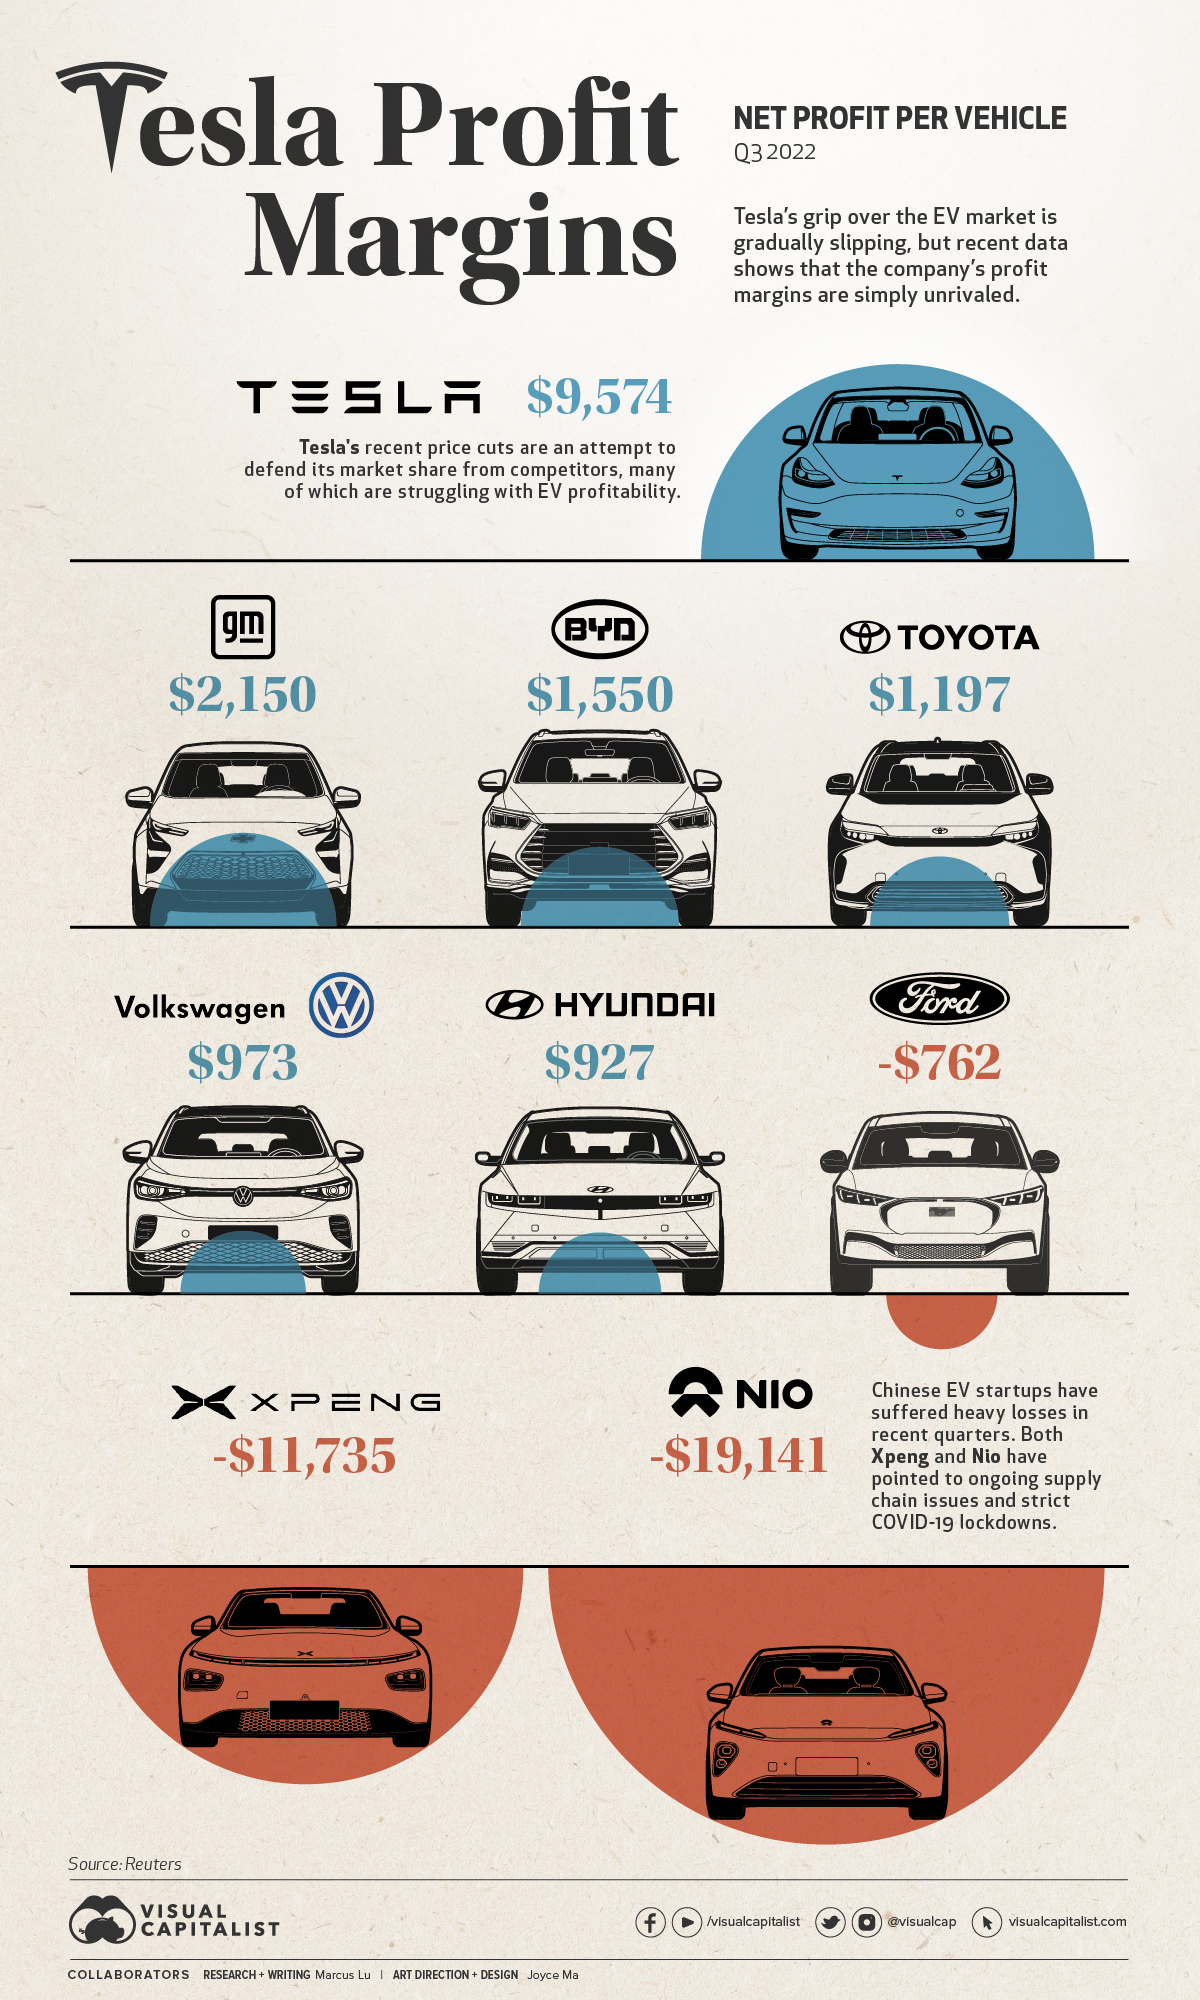


Chart: Tesla’s Unrivaled Profit Margins
In January this year, Tesla made the surprising announcement that it would be cutting prices on its vehicles by as much as 20%.
While price cuts are not new in the automotive world, they are for Tesla. The company, which historically has been unable to keep up with demand, has seen its order backlog shrink from 476,000 units in July 2022, to 74,000 in December 2022.
This has been attributed to Tesla’s robust production growth, which saw 2022 production increase 41% over 2021 (from 930,422 to 1,313,851 units).
With the days of “endless” demand seemingly over, Tesla is going on the offensive by reducing its prices—a move that puts pressure on competitors, but has also angered existing owners.
Cranking up the Heat
Tesla’s price cuts are an attempt to protect its market share, but they’re not exactly the desperation move some media outlets have claimed them to be.
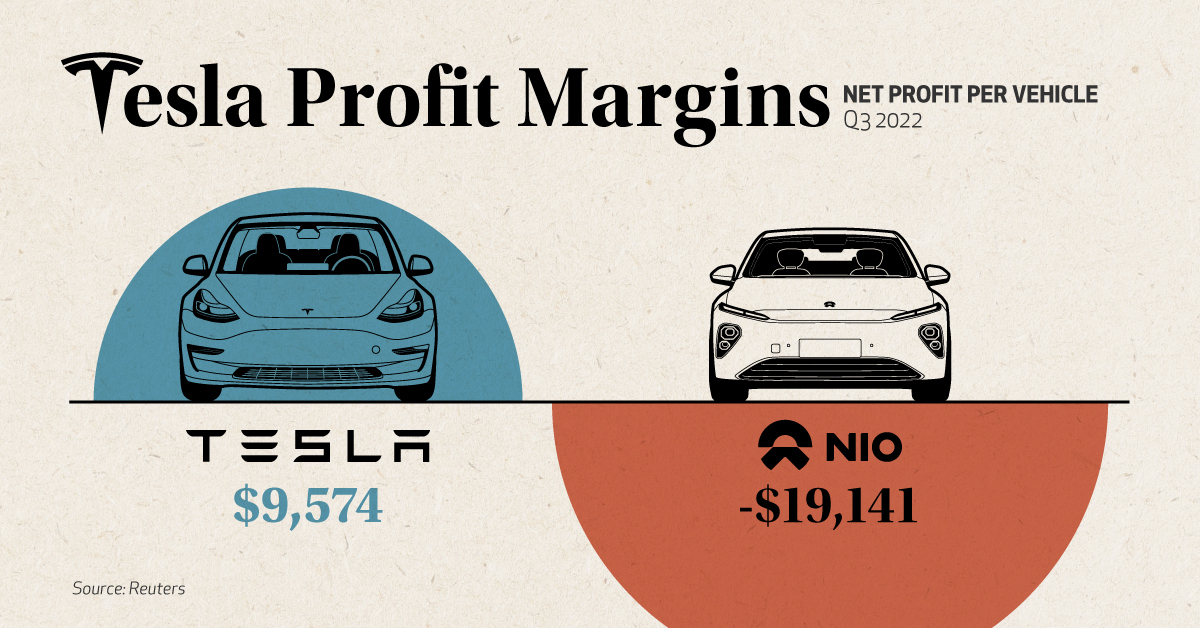
Recent data compiled by Reuters shows that Tesla’s margins are significantly higher than those of its rivals, both in terms of gross and net profit. Our graphic only illustrates the net figures, but gross profits are also included in the table below.
| Company | Gross profit per car | Net profit per car |
|---|---|---|
| 🇺🇸 Tesla | $15,653 | $9,574 |
| 🇺🇸 GM | $3,818 | $2,150 |
| 🇨🇳 BYD | $5,456 | $1,550 |
| 🇯🇵 Toyota | $3,925 | $1,197 |
| 🇩🇪 VW | $6,034 | $973 |
| 🇰🇷 Hyundai | $5,362 | $927 |
| 🇺🇸 Ford | $3,115 | -$762 |
| 🇨🇳 Xpeng | $4,565 | -$11,735 |
| 🇨🇳 Nio | $8,036 | -$19,141 |
Data from Q3 2022
Price cutting has its drawbacks, but one could argue that the benefits for Tesla are worth it based on this data—especially in a critical market like China.
Tesla has taken the nuclear option to bully the weaker, thin margin players off the table.
– Bill Russo, Automobility
In the case of Chinese EV startups Xpeng and Nio, net profits are non-existent, meaning it’s unlikely they’ll be able to match Tesla’s reductions in price. Both firms have reported year-on-year sales declines in January.
As for Tesla, Chinese media outlets have claimed that the firm received 30,000 orders within three days of its price cut announcement. Note that this hasn’t been officially confirmed by anyone within the company.
Tit for Tat
Ford made headlines recently for announcing its own price cuts on the Mustang Mach-E electric SUV. The model is a direct competitor to Tesla’s best-selling Model Y.
Chevrolet and Hyundai have also adjusted some of their EV prices in recent months, as listed in the following table.
| Model | Old Price | New Price | Discount |
|---|---|---|---|
| Tesla Model Y Long Range | $65,990 | $53,490 | 18.9% |
| Chevrolet Bolt EUV 2023 | $33,500 | $27,200 | 18.8% |
| Tesla Model Y Performance | $69,990 | $56,990 | 18.6% |
| Chevrolet Bolt 2023 | $31,600 | $26,500 | 16.1% |
| Tesla Model 3 Performance | $62,990 | $53,990 | 14.3% |
| Hyundai Kona Electric 2022 | $37,390 | $34,000 | 9.1% |
| Ford Mustang Mach-E GT Extended Range | $69,900 | $64,000 | 8.4% |
| Tesla Model 3 Long Range | $46,990 | $43,990 | 6.4% |
| Ford Mustang Mach-E Premium AWD | $57,675 | $53,995 | 6.4% |
| Ford Mustang Mach-E RWD Standard Range | $46,900 | $46,000 | 1.9% |
Source: Observer (Feb 2023)
Volkswagen is a noteworthy player missing from this table. The company has been gaining ground on Tesla, especially in the European market.
We have a clear pricing strategy and are focusing on reliability. We trust in the strength of our products and brands.
– Oliver Blume, CEO, VW Group
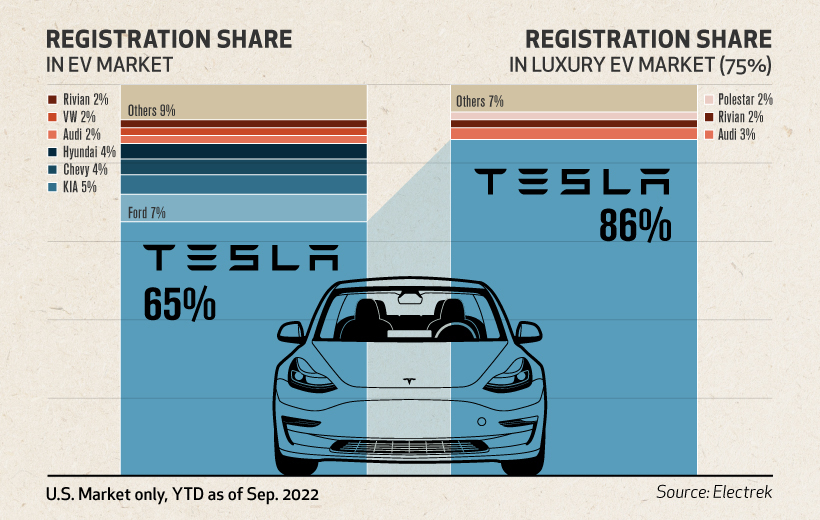
This decision could hamper Volkswagen’s goal of becoming a dominant player in EVs, especially if more automakers join Tesla in cutting prices. For now, Tesla still holds a strong grip on the US market.
Thanks, Elon
Recent Tesla buyers became outraged when the company announced it would be slashing prices on its cars. In China, buyers even staged protests at Tesla stores and delivery centers.
Recent buyers not only missed out on a better price, but their cars have effectively depreciated by the amount of the cut. This is a bitter turn of events, given Musk’s 2019 claims that a Tesla would be an appreciating asset.
I think the most profound thing is that if you buy a Tesla today, I believe you are buying an appreciating asset – not a depreciating asset.
– Elon Musk, CEO, Tesla
These comments were made in reference to Tesla’s full self-driving (FSD) capabilities, which Elon claimed would enable owners to turn their cars into robotaxis.


Markets
Mapped: Europe’s GDP Per Capita, by Country
Which European economies are richest on a GDP per capita basis? This map shows the results for 44 countries across the continent.


Mapped: Europe’s GDP Per Capita, by Country (2024)
This was originally posted on our Voronoi app. Download the app for free on iOS or Android and discover incredible data-driven charts from a variety of trusted sources.
Europe is home to some of the largest and most sophisticated economies in the world. But how do countries in the region compare with each other on a per capita productivity basis?
In this map, we show Europe’s GDP per capita levels across 44 nations in current U.S. dollars. Data for this visualization and article is sourced from the International Monetary Fund (IMF) via their DataMapper tool, updated April 2024.
Europe’s Richest and Poorest Nations, By GDP Per Capita
Luxembourg, Ireland, and Switzerland, lead the list of Europe’s richest nations by GDP per capita, all above $100,000.
| Rank | Country | GDP Per Capita (2024) |
|---|---|---|
| 1 | 🇱🇺 Luxembourg | $131,380 |
| 2 | 🇮🇪 Ireland | $106,060 |
| 3 | 🇨🇭 Switzerland | $105,670 |
| 4 | 🇳🇴 Norway | $94,660 |
| 5 | 🇮🇸 Iceland | $84,590 |
| 6 | 🇩🇰 Denmark | $68,900 |
| 7 | 🇳🇱 Netherlands | $63,750 |
| 8 | 🇸🇲 San Marino | $59,410 |
| 9 | 🇦🇹 Austria | $59,230 |
| 10 | 🇸🇪 Sweden | $58,530 |
| 11 | 🇧🇪 Belgium | $55,540 |
| 12 | 🇫🇮 Finland | $55,130 |
| 13 | 🇩🇪 Germany | $54,290 |
| 14 | 🇬🇧 UK | $51,070 |
| 15 | 🇫🇷 France | $47,360 |
| 16 | 🇦🇩 Andorra | $44,900 |
| 17 | 🇲🇹 Malta | $41,740 |
| 18 | 🇮🇹 Italy | $39,580 |
| 19 | 🇨🇾 Cyprus | $37,150 |
| 20 | 🇪🇸 Spain | $34,050 |
| 21 | 🇸🇮 Slovenia | $34,030 |
| 22 | 🇪🇪 Estonia | $31,850 |
| 23 | 🇨🇿 Czech Republic | $29,800 |
| 24 | 🇵🇹 Portugal | $28,970 |
| 25 | 🇱🇹 Lithuania | $28,410 |
| 26 | 🇸🇰 Slovakia | $25,930 |
| 27 | 🇱🇻 Latvia | $24,190 |
| 28 | 🇬🇷 Greece | $23,970 |
| 29 | 🇭🇺 Hungary | $23,320 |
| 30 | 🇵🇱 Poland | $23,010 |
| 31 | 🇭🇷 Croatia | $22,970 |
| 32 | 🇷🇴 Romania | $19,530 |
| 33 | 🇧🇬 Bulgaria | $16,940 |
| 34 | 🇷🇺 Russia | $14,390 |
| 35 | 🇹🇷 Türkiye | $12,760 |
| 36 | 🇲🇪 Montenegro | $12,650 |
| 37 | 🇷🇸 Serbia | $12,380 |
| 38 | 🇦🇱 Albania | $8,920 |
| 39 | 🇧🇦 Bosnia & Herzegovina | $8,420 |
| 40 | 🇲🇰 North Macedonia | $7,690 |
| 41 | 🇧🇾 Belarus | $7,560 |
| 42 | 🇲🇩 Moldova | $7,490 |
| 43 | 🇽🇰 Kosovo | $6,390 |
| 44 | 🇺🇦 Ukraine | $5,660 |
| N/A | 🇪🇺 EU Average | $44,200 |
Note: Figures are rounded.
Three Nordic countries (Norway, Iceland, Denmark) also place highly, between $70,000-90,000. Other Nordic peers, Sweden and Finland rank just outside the top 10, between $55,000-60,000.
Meanwhile, Europe’s biggest economies in absolute terms, Germany, UK, and France, rank closer to the middle of the top 20, with GDP per capitas around $50,000.
Finally, at the end of the scale, Eastern Europe as a whole tends to have much lower per capita GDPs. In that group, Ukraine ranks last, at $5,660.
A Closer Look at Ukraine
For a broader comparison, Ukraine’s per capita GDP is similar to Iran ($5,310), El Salvador ($5,540), and Guatemala ($5,680).
According to experts, Ukraine’s economy has historically underperformed to expectations. After the fall of the Berlin Wall, the economy contracted for five straight years. Its transition to a Western, liberalized economic structure was overshadowed by widespread corruption, a limited taxpool, and few revenue sources.
Politically, its transformation from authoritarian regime to civil democracy has proved difficult, especially when it comes to institution building.
Finally, after the 2022 invasion of the country, Ukraine’s GDP contracted by 30% in a single year—the largest loss since independence. Large scale emigration—to the tune of six million refugees—is also playing a role.
Despite these challenges, the country’s economic growth has somewhat stabilized while fighting continues.

-

 Markets6 days ago
Visualized: Interest Rate Forecasts for Advanced Economies
-

 Markets2 weeks ago
Economic Growth Forecasts for G7 and BRICS Countries in 2024
-

 Wealth2 weeks ago
Charted: Which City Has the Most Billionaires in 2024?
-

 Technology2 weeks ago
All of the Grants Given by the U.S. CHIPS Act
-

 Green2 weeks ago
The Carbon Footprint of Major Travel Methods
-

 United States1 week ago
Visualizing the Most Common Pets in the U.S.
-

 Culture1 week ago
The World’s Top Media Franchises by All-Time Revenue
-

 voronoi1 week ago
Best Visualizations of April on the Voronoi App